By Anim Rahman · 12 September 2026
My Blender Career Graph: Turning My Portfolio Into a 3D World
How I used Blender to turn my career into an interactive 3D portfolio, connecting real projects through a miniature town and a guided eight-stop tour.
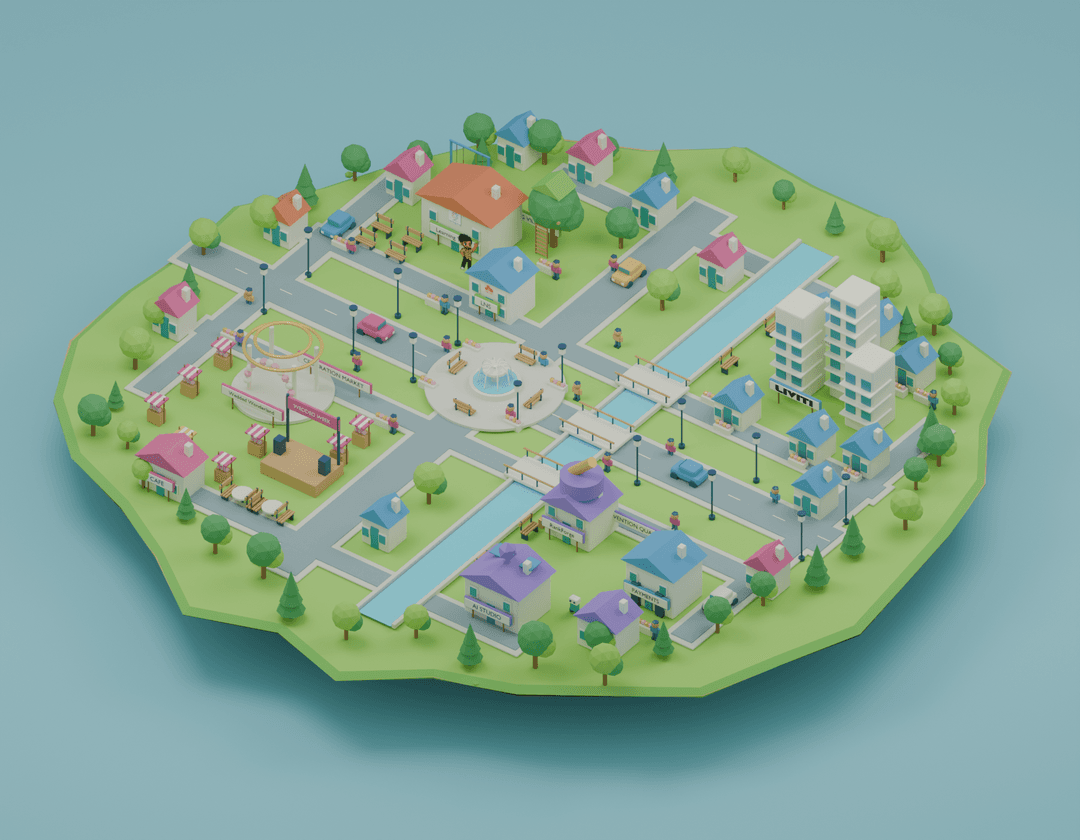
My career has taken me through humanitarian technology, property products, marketplaces, payments and AI delivery.
Putting those experiences together raised an interesting design question: how could I help someone explore the connections between them?
I built a 3D career graph in Blender, then brought it into the browser as an interactive portfolio called Career World.
The result is a miniature town of real projects, organised into four districts. Visitors can explore the streets or follow my character through eight project stops.
It is a playful way to examine a serious subject: the work I have done, the responsibilities I have held, and how those experiences connect.
Giving the career map a structure
The visual concept needed a clear organising principle.
I grouped the projects by the kinds of problems and products they represent. That became the town's four districts:
- Learning Village: Learning Tree and LNS, representing education and humanitarian technology.
- Property District: Liviti and the experience of building property products.
- Celebration Market: Wedded Wonderland and Wedded Week, connecting communities, vendors and commerce.
- Invention Quarter: RankForge, payment infrastructure, and AI strategy and delivery.
These groupings give visitors an initial sense of the portfolio before they open individual projects.
They also helped me see a consistent thread in my own career: understanding people's needs, translating them into a usable product direction, and staying close to delivery.
The industries change. Those responsibilities keep appearing.
From Blender model to interactive portfolio
Blender provided the foundation for the town: buildings, streets, project signs, materials, lighting and the overall composition.
I kept an editable Blender model and exported a GLB asset for the web. Three.js brings the model into the browser, where the interface adds navigation, project selection and information panels.
The transition from a rendered scene to an interactive experience introduces another set of design decisions.
A render has one carefully chosen viewpoint. An interactive portfolio needs to remain understandable as someone moves around, changes the zoom, or opens it on a smaller screen.
The 3D world and its interface have to work together. A building can catch someone's attention; the project panel then needs to explain why that place matters.
Making the work behind each project visible
Every stop needs to connect the visual idea to something concrete.
Learning Tree, for example, introduces my work on an offline-capable learning platform for teachers and caregivers in humanitarian programmes. Liviti connects to property experiences and product delivery. The marketplace and invention districts bring together work across weddings, SEO and payments.
The accompanying information identifies my role and contributions, giving visitors something more useful than a collection of logos. My project portfolio provides another route into that work if you prefer a conventional overview.
This was an important constraint: the environment should help people discover the work and understand my involvement.
A memorable presentation earns attention. The details give that attention somewhere useful to go.
Designing for exploration and quick answers
Different visitors will approach an interactive career map differently.
Some will want to look around. Others will want guidance. Someone assessing my experience may want to find a particular project immediately.
Career World provides free exploration, a guided tour through eight stops, and a text directory for people who prefer to read.
Mobile use also changes the design problem. A label that looks well placed on a desktop can drift towards the edge of a phone screen. Project information needs enough room to remain readable, and navigation needs to be understandable without a mouse.
Working through those details made the project a practical exercise in responsive interaction design.
What building a 3D career graph taught me
The most useful part of the process was deciding how to organise the career itself.
To give a project a place in the town, I had to be clear about what it represented. To write its panel, I had to explain my contribution. To connect it to the next stop, I had to think about the relationship between different kinds of work.
That exercise made the portfolio more deliberate.
It also gave me an opportunity to bring together Blender, web development, storytelling and product design in one personal project. In The Journey, my personal story game, I used a different interactive format to share the life milestones alongside that career.
A CV remains useful for a quick overview of roles and dates. Career World adds another way to explore the projects behind them, at a pace the visitor chooses.
You can explore my interactive Career World and follow the eight-stop tour.
If you mapped your career as a place, what would its different neighbourhoods represent?
From a creative idea to a product
The process behind Career World overlaps with my product strategy and delivery services: clarify what people need, make the concept tangible, and test whether the experience helps them.
If you are at the idea stage and want prompts for content or visual exploration, my Supecoder Ultimate AI Bundle includes GPT prompts, AI art prompts, ebooks and planners. It is a separate paid resource, rather than a Blender course or a download of this 3D model.
If you need help shaping an interactive portfolio or another digital product, get in touch about your project.